
PLAN VS PERFORMANCE
План-факт анализ
Загрузите файл Excel или CSV and instantly compare planned values with actual performance. See total variance, variance percentage, over-budget categories, favorable results, and a clean management report.
✓ Automatic variance✓ Excel & CSV✓ Workspace saving✓ Печать / PDF
FY 2026 PERFORMANCEBudget vs Actual
Budget$520KActual$548KVariance+$28K
3columns needed
Instantvariance analysis
Flexiblerevenue or expense logic
Готовоfor monthly reviews
LIVE WORKSPACE
Compare budget with actual results
Загрузка a structured table, then confirm which columns contain the budget, actual value, and category or period.
UPLOAD YOUR PLANDrop a budget spreadsheet here
Лучший результат: one header row, one category or period per row, and separate Budget and Actual columns.
XLSXXLSMXLSCSV
1 Загрузка2 Map columns3 Проверить insights4 Save or export
BUDGET PERFORMANCE REPORT
Budget vs Actual Analysis
Создатьd from your spreadsheet.
Your report summary will appear here
Загрузка a file or load the example to generate a concise management overview.
Рекомендацияs will be created from the largest favorable and unfavorable variances.
PLAN VS RESULT
Top categories by budgetBudget and actual by category
STATUS
Variance distribution
—on plan
MANAGEMENT SUMMARY
What needs attention
DETAILED VARIANCE
Категория performance
Tracker savedYour analysis is available in Workspace.
Open saved tracker →Turn a monthly spreadsheet into a clear variance report.
Загрузка planned and actual values
Use departments, expense categories, projects, months, locations, or products as rows.
Confirm the column mapping
ЛистWise detects numeric columns and lets you select Budget, Actual, and Group By.
Проверить, save, and report
Find unfavorable variances, export the detailed CSV, save to Workspace, or print a PDF.
A complete variance report—not another plain spreadsheet.
До you upload anything, see the kind of management-ready output ЛистWise creates from a simple budget table.
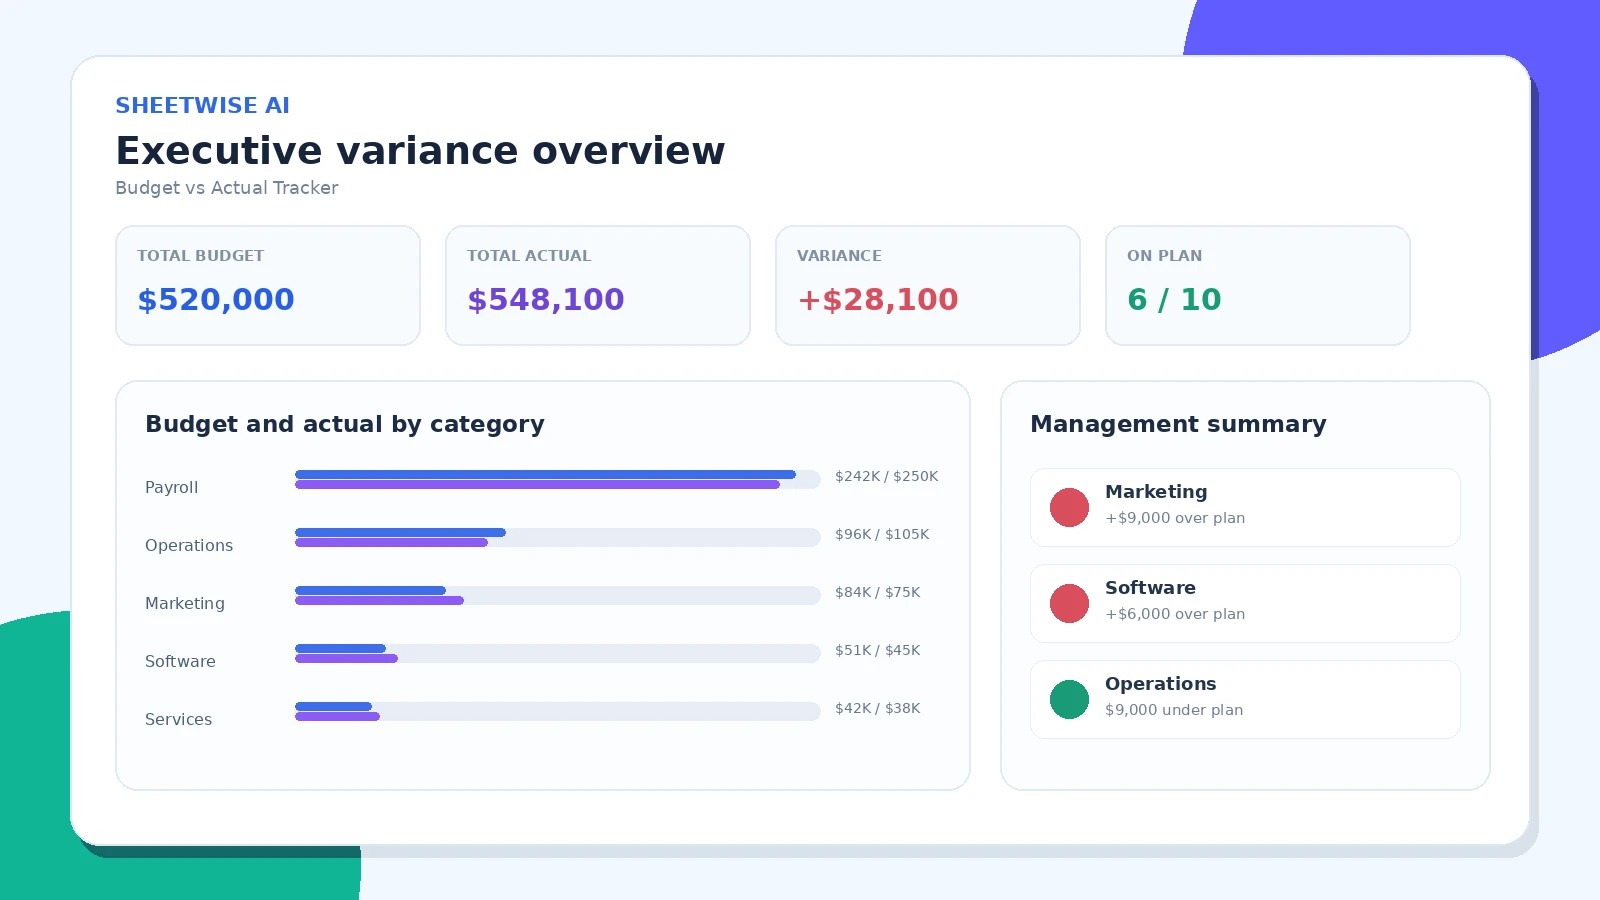
EXECUTIVE OVERVIEW
See the financial story at a glance
Итогоs, variance percentage, category performance, visual comparisons, and a management summary appear together in one clean report.
- Instant KPI totals
- Budget vs actual category chart
- Favorable and unfavorable status
- Leadership-ready summary
DEPARTMENT CONTROL
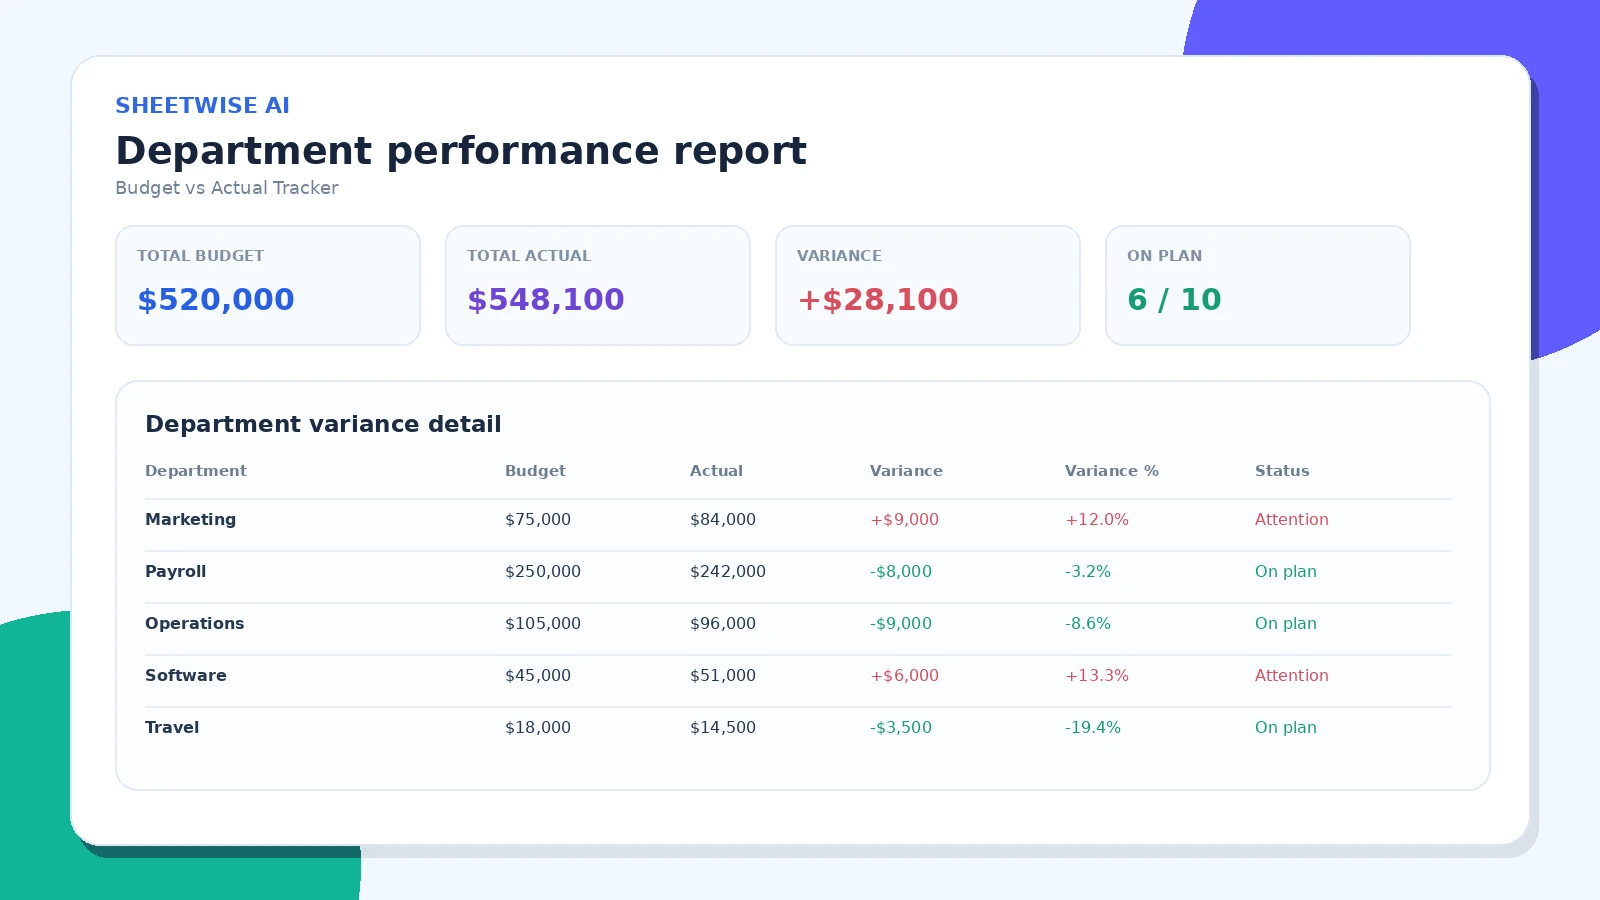
Find exactly where the variance comes from
Проверить each department, project, location, or category with amount variance, variance percentage, and a clear status.
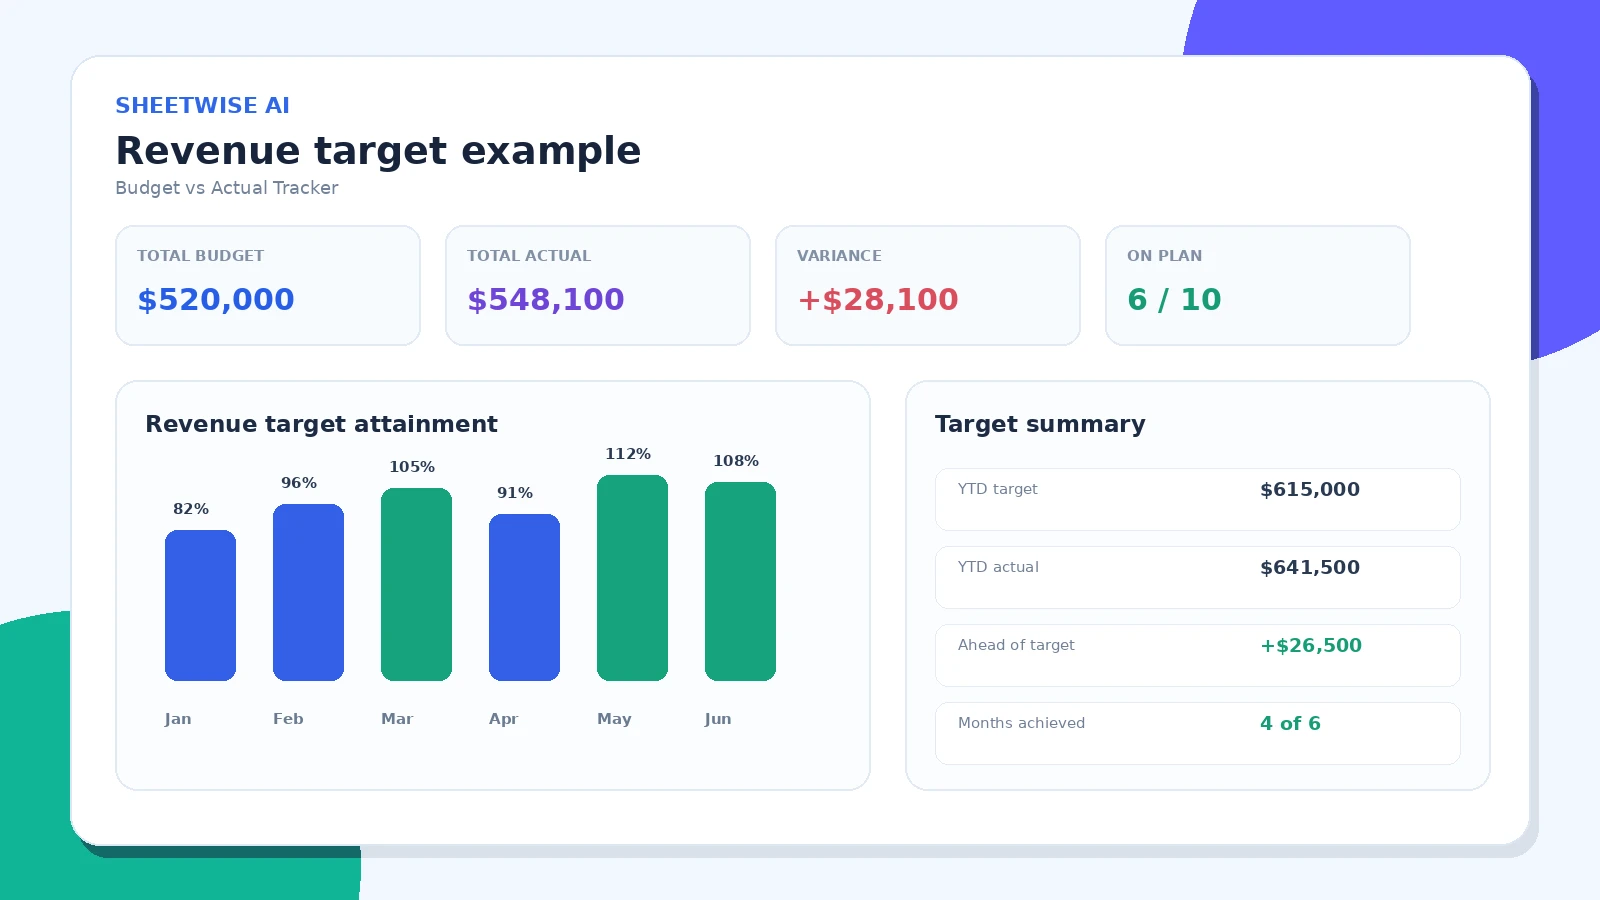
REVENUE & TARGETS
Use the same tracker for sales performance
Change the favorable direction to “Actual is higher” and compare revenue, units, leads, or any other target-based metric.
One tracker for finance, operations, projects, and growth.
Use the same workflow for recurring reviews across the business.
Department expenses
Compare approved departmental budgets with spending and spot overspending before month-end.
Маркетинг · Payroll · Операционная работаВыручка targets
Set higher actual values as favorable and measure sales, bookings, leads, or units against targets.
Monthly sales · Товар goals · РегионsProject cost control
Track planned and incurred costs across projects, phases, contractors, vendors, or client engagements.
Projects · Phases · ПоставщикsMonthly operations
Создание a consistent performance report for finance meetings, leadership reviews, and board updates.
Monthly close · Forecast review · ReportingLocation performance
Compare plan and actual values by store, branch, market, territory, or business unit.
Stores · Branches · MarketsCampaign monitoring
Measure campaign spend, leads, conversions, or revenue against the original marketing plan.
Campaigns · Channels · ROI reviewsMove from raw numbers to decisions.
No formulas to build
Variance amount, variance percentage, totals, and status are calculated automatically.
No chart setup
Your most important categories are visualized immediately with budget and actual values side by side.
No manual executive summary
The report surfaces the strongest favorable result and the largest item needing attention.
Готово to share
Save the analysis to Workspace, export a detailed CSV, or create a polished Печать / PDF report.
A simple table is all you need.
КатегорияМаркетингPayrollSoftware
Budget7500025000045000
Actual8400024200051000
Use clear headers and numeric values. Currency symbols and commas are accepted.
План-факт анализ questions
What files can I upload?+
Загрузка XLSX, XLSM, XLS, or CSV files with columns for a category or period, budget, and actual results.
Does the tracker calculate variance automatically?+
Yes. ЛистWise calculates amount variance, percentage variance, totals, and category-level performance automatically.
Can I track revenue as well as expenses?+
Yes. Choose whether higher actual values are favorable or unfavorable so the status logic fits revenue, expenses, hours, or other measures.
Can I change the detected columns?+
Yes. Select the Budget, Actual, and Group By columns after upload and the tracker recalculates instantly.
Can I save the analysis?+
Yes. Save the tracker to your private Workspace and reopen it later.
Can I export the result?+
Yes. Скачать a detailed CSV variance report or use Печать / PDF for a management-ready report.
READY TO COMPARE?
See where the plan and reality differ.
Загрузка your budget file and build a management-ready variance report in minutes.
Как вам работа с SheetWise?
Расскажите, какую задачу вы решили. Перед публикацией каждый отзыв проверяется.