
Дашборд запасов и пополнения Pro
Загрузить Excel или CSV inventory data and instantly see stock value, low-stock products, out-of-stock risk, overstock, slow-moving items, dead stock, reorder priorities, and supplier exposure.
Needs attention
Executive insight: Reorder shipping labels, USB-C hubs, and LED desk lamps. Reduce purchases of slow-moving office accessories.
A complete inventory dashboard built for action.
See exactly what to reorder, what is tying up cash, which suppliers matter most, and where stock risk is building.
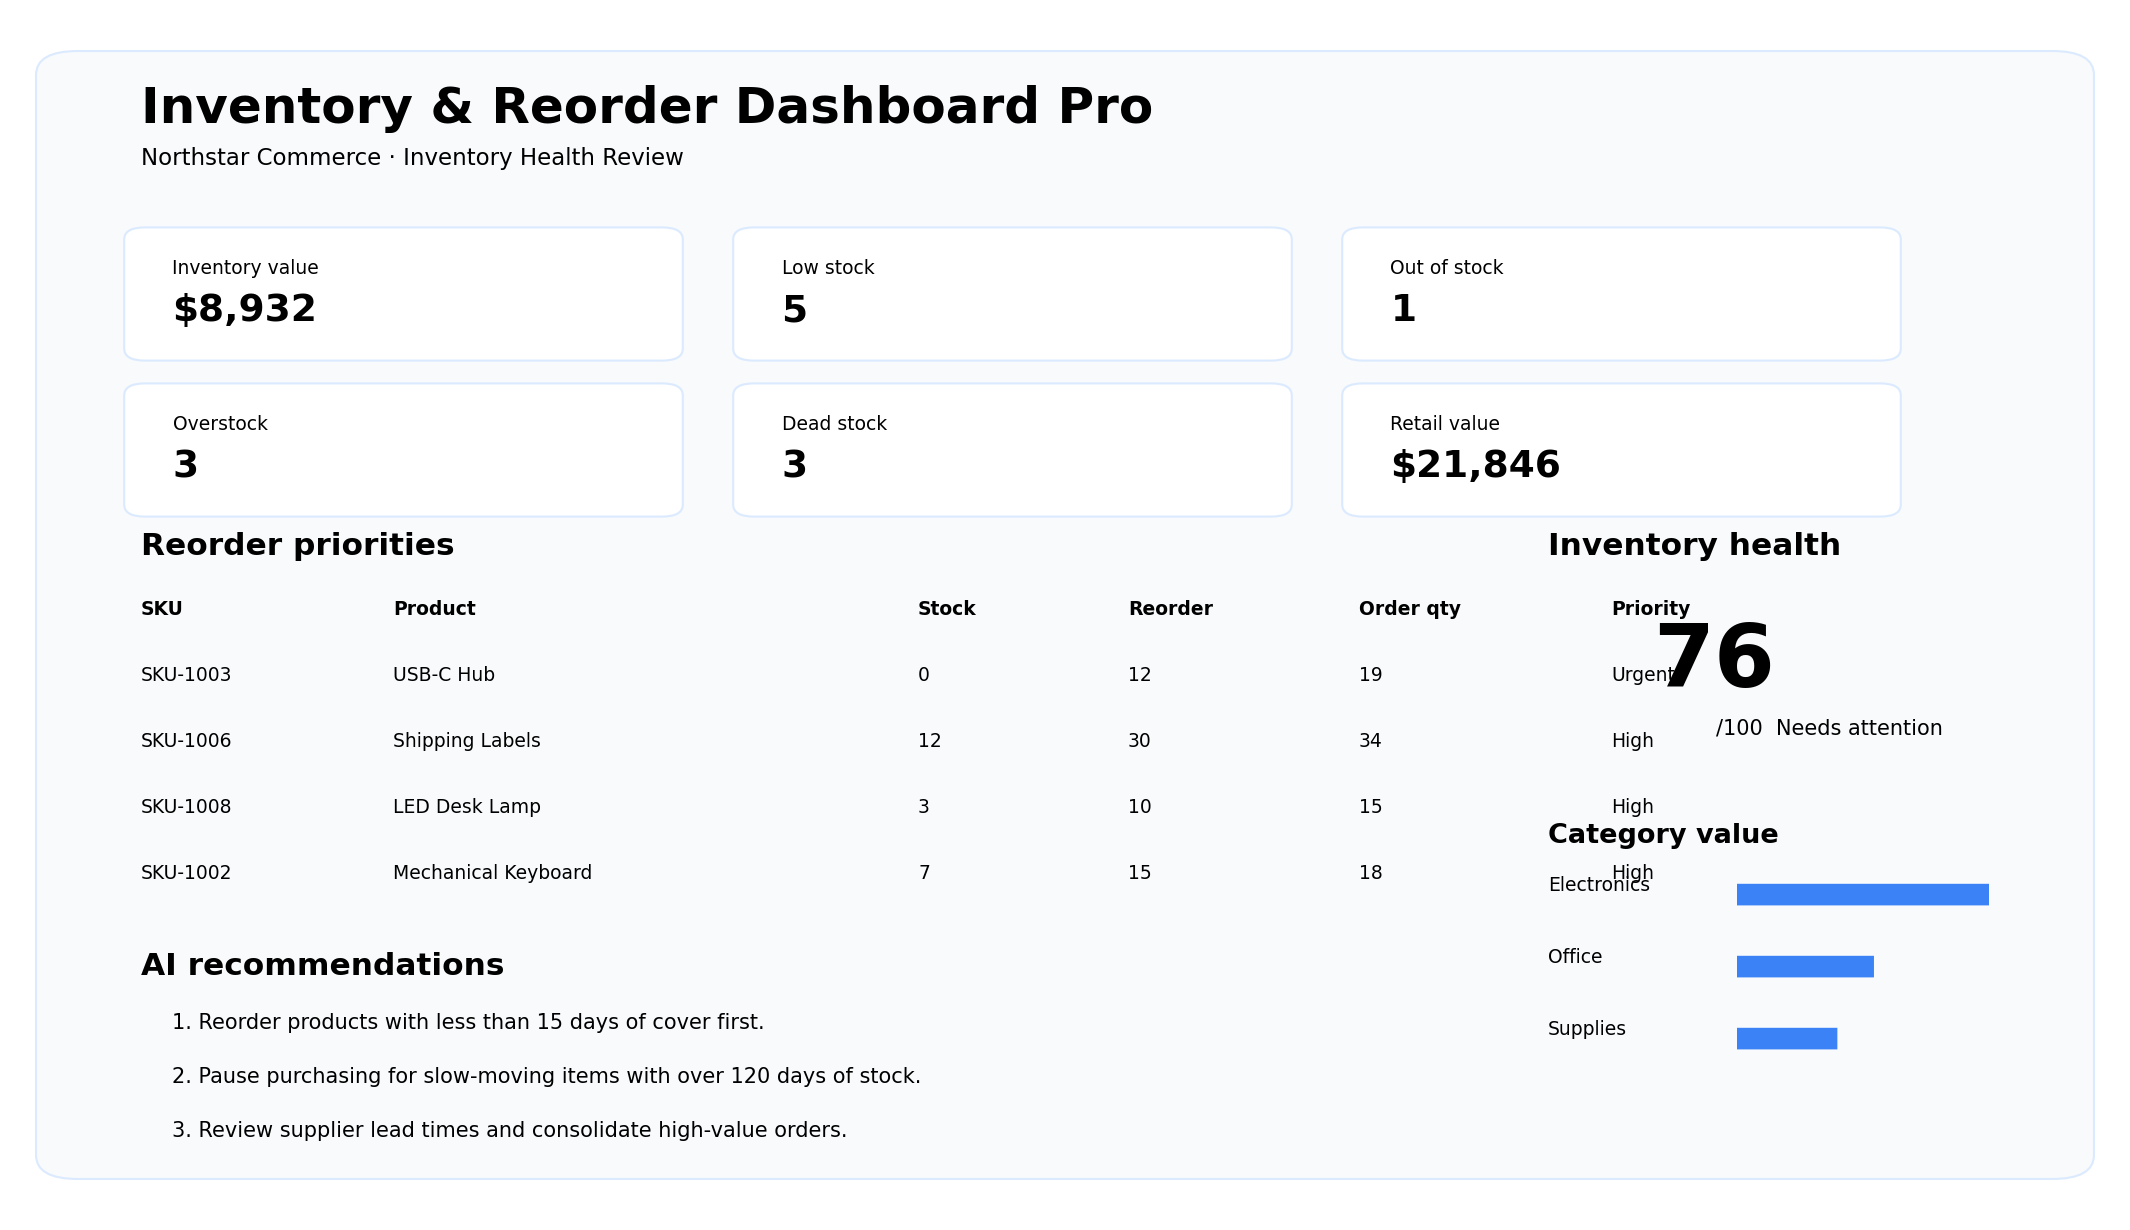
Stock health
Inventory value, low stock, out of stock, overstock, and dead stock.
Reorder priorities
Recommended quantities, urgency, lead times, and days of cover.
Cash efficiency
Find products that are tying up cash without enough sales velocity.
Build the inventory dashboard
Загрузка product-level data. The dashboard detects SKU, product, category, supplier, stock, reorder point, sales velocity, cost, price, and lead time.
Recommended columns: SKU, Товар, Категория, Supplier, Stock On Hand, Reorder Point, Monthly Продажи, Unit Cost, Unit Price, Lead Time Days, Last Sale Дата.
Inventory Health Проверить
Prepared by ЛистWise AI
Товарs requiring the fastest action
| SKU | Товар | Stock | Reorder point | Recommended order | Days cover | Priority |
|---|
From stock list to a clear purchasing plan.
Загрузка
Use inventory exports, POS data, warehouse sheets, or your own spreadsheet.
Анализ
ЛистWise calculates value, stock coverage, reorder needs, overstock, and dead stock.
Prioritize
See which products and suppliers require attention first.
Act
Save, print, or export a professional inventory report.
Keep products available without trapping cash in stock.
Prevent stockouts
Identify products that need replenishment before sales are lost.
Reduce overstock
Find excess inventory and slow-moving products that tie up cash.
Prioritize purchasing
Rank orders by urgency, sales velocity, and lead time.
Track suppliers
Understand supplier concentration and purchasing exposure.
Improve margins
Compare inventory cost with potential sales value.
Report professionally
Share a management-ready inventory report with partners or advisors.
Inventory & Reorder Dashboard questions
What data can I upload?
Excel or CSV files with SKU, product, category, supplier, stock on hand, reorder point, monthly sales, unit cost, unit price, lead time, and optional last sale date.
How is the reorder recommendation calculated?
The tool estimates demand during lead time, compares it with current stock, and adds a practical safety buffer.
How is dead stock detected?
Товарs with very low sales velocity, high months of stock, or an old last-sale date are highlighted as dead or slow-moving.
Can I test it without a file?
Yes. Load the professional example or download the included sample workbook.
Can I print or export the report?
Yes. Use Open PDF & Print, download an Excel-compatible export, or save the report to Workspace.
Does it work on iPad and mobile?
Yes. Загрузка, analysis, report viewing, saving, and printing are responsive.