
BUILD WITH AI
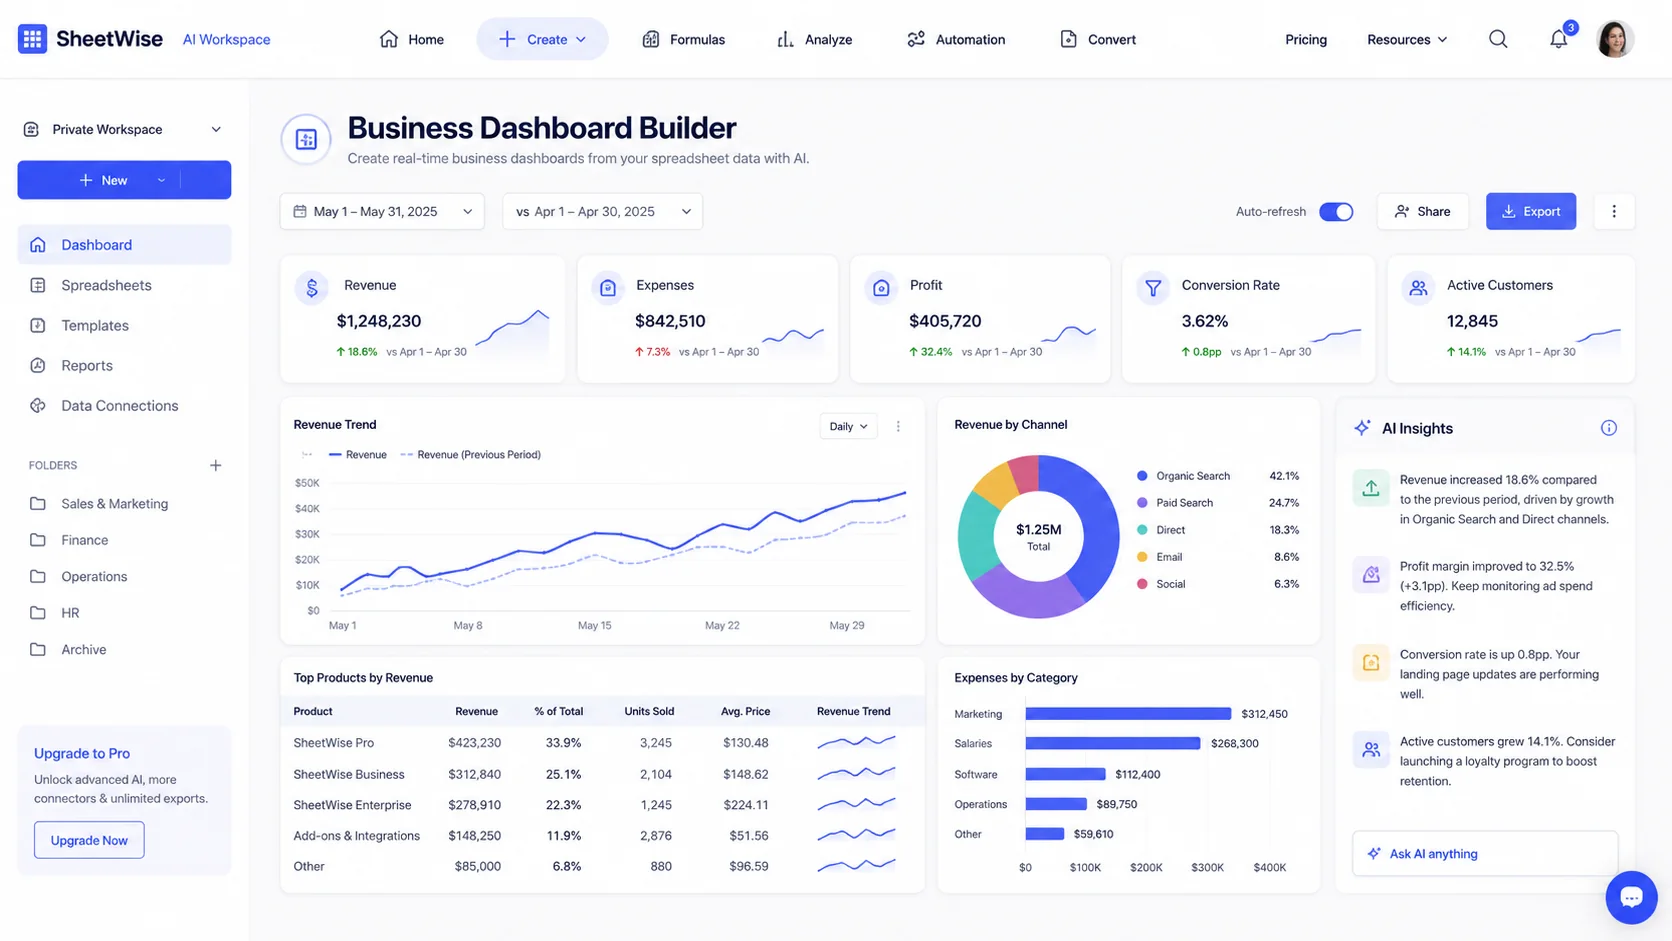
Business Dashboard Builder
Turn Excel or CSV data into a professional KPI dashboard with charts, summaries, category comparisons, and AI-powered business insights—without building formulas or charts manually.
✓ Excel and CSV✓ AI insights✓ Save to Workspace✓ Print / PDF
LIVE WORKSPACE
Build your dashboard now
Upload your own spreadsheet or load the example. SheetWise detects useful numeric and category columns and prepares the dashboard automatically.
CHOOSE YOUR DATA SOURCE
How would you like to add your data?
Use a file, paste a table, enter rows directly, or build a fast executive dashboard from key business metrics.
PASTE SPREADSHEET DATA
Paste a copied range with headers
Copy cells from Excel or Google Sheets, including the first header row.
MANUAL DATA ENTRY
Enter monthly or category-level business data
Edit cells directly. Add rows as needed, then build the same professional dashboard.
| Period | Category | Revenue | Expenses | Customers |
|---|
QUICK EXECUTIVE DASHBOARD
Create a dashboard from essential business metrics
Ideal when you have monthly totals but no prepared spreadsheet.
↥
START WITH YOUR DATACreate a polished dashboard from Excel or CSVDrop a structured spreadsheet here. SheetWise will detect metrics, categories, KPIs, charts, and business insights automatically.
XLSXXLSMXLSCSV
DATA PREVIEW
Ready for dashboard
Review your data before building the dashboard
Confirm the detected sheet, fields, data quality, and sample rows. Nothing is generated until you approve this preview.
DETECTED FIELDS
What SheetWise found
Numeric metrics
Category and period fields
VALIDATION
Data readiness check
SAMPLE RECORDS
Preview onlyFirst rows from your data
EXECUTIVE OVERVIEW
Automatically detected from your dataBusiness performance at a glance
PERFORMANCE TREND
First available recordsMetric trend
BREAKDOWN
Share by category
—Total
AI INSIGHTS
What stands out
Business summary
Upload a spreadsheet to generate a concise management summary.
No risks detected yet.
No opportunities detected yet.
TOP PERFORMANCE
Top categories
DATA PREVIEW
Source rows
Dashboard savedYour dashboard is available in Workspace.
Open saved dashboard →From raw spreadsheet to useful dashboard in three steps.
SheetWise removes the repetitive work of selecting ranges, building formulas, choosing charts, and writing a management summary.
Upload a clean data table
Choose an Excel or CSV export with one header row and one business record per row. Sales, finance, marketing, inventory, and operations files all work.
Example: Date · Region · Revenue · Expenses · OrdersLet SheetWise build the first analysis
The builder identifies numeric measures and text dimensions, calculates KPIs, creates trend and category views, and checks the preview for obvious data issues.
No formulas, pivots, or chart setup requiredRefine, save, and share
Switch the primary metric or grouping, refresh AI insights, save the dashboard with a clear name, download PNG or CSV, and create a PDF-ready printout.
Designed for recurring management reportingUse the same builder for different business questions.
The layout adapts to the columns in your spreadsheet, so one workspace can support sales, budgeting, finance, marketing, and operations reporting.
EXECUTIVE OVERVIEW
See the numbers management cares about first
Present total performance, averages, top categories, source records, and AI observations in one structured dashboard.
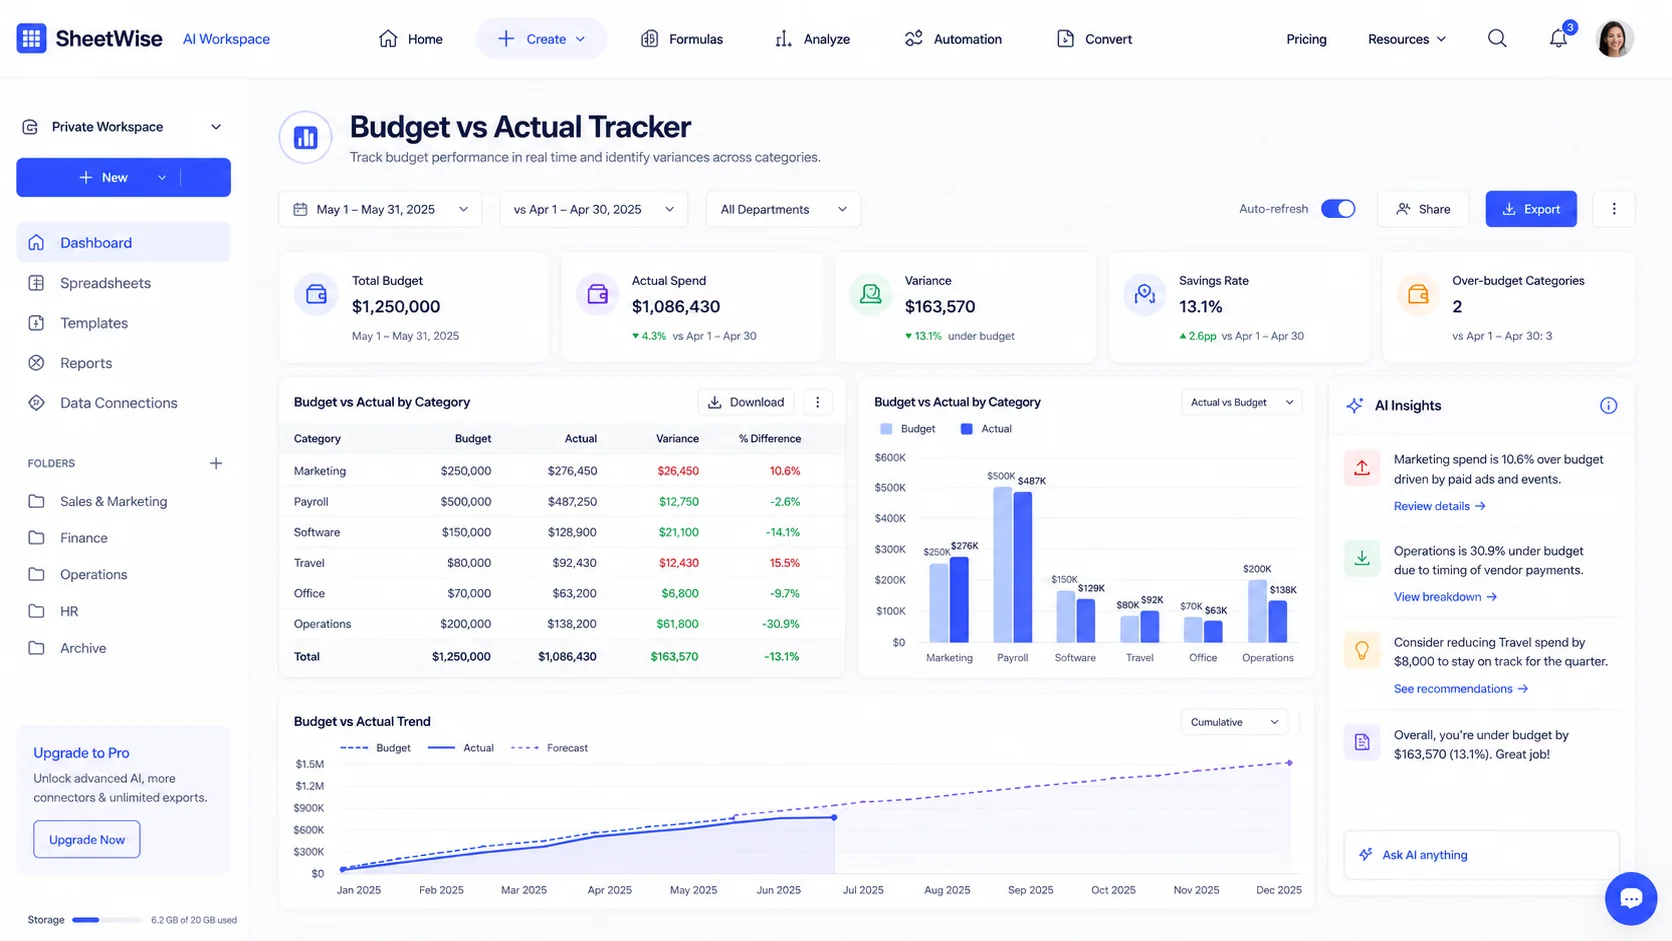
BUDGET REPORTING
Compare budget versus actual
Find overspending, savings, variance by category, and monthly movement.
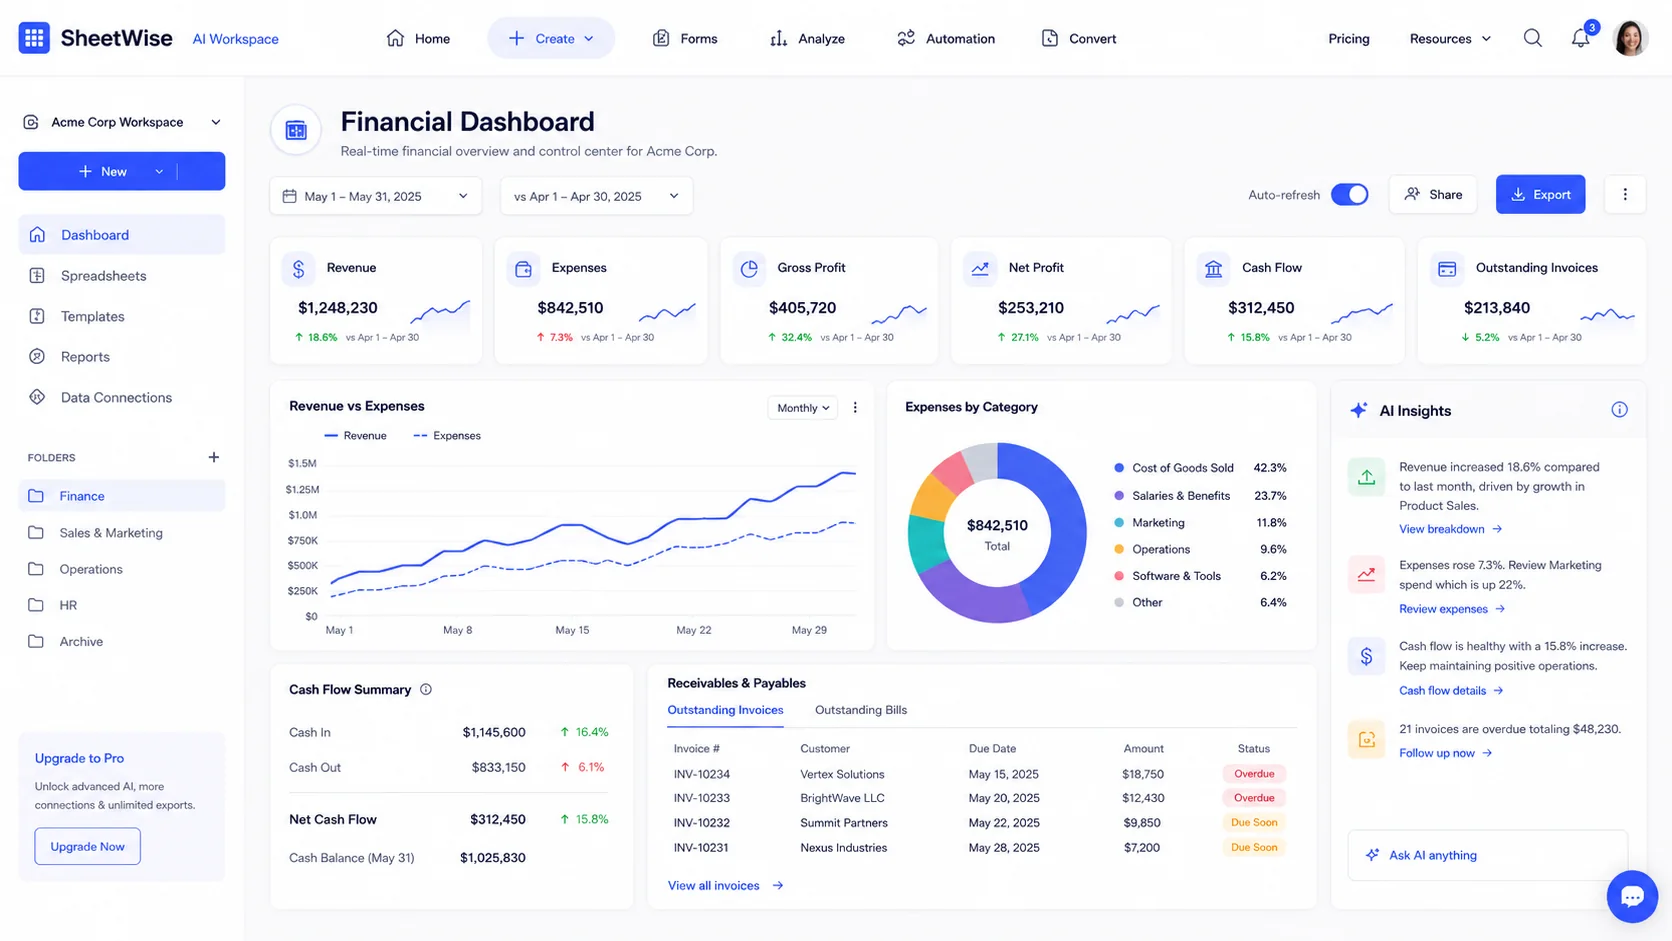
FINANCIAL OVERVIEW
Monitor revenue, expenses, profit and cash flow
Turn accounting or finance exports into a readable performance overview.
A complete first-pass business analysis, not just one chart.
The builder combines the most useful views into a consistent report that is easier to review and present.
Automatic KPI summary
Total, average, highest value, record count, column count, and data-health status.
Interactive metric selection
Switch between revenue, expenses, profit, quantity, customers, or any detected numeric column.
Category and trend analysis
Compare regions, products, channels, departments, months, customers, or other business dimensions.
AI-written observations
Receive a concise explanation of notable results and possible follow-up questions.
Workspace and export actions
Save the analysis, print a PDF-ready view, or download a CSV summary.
One dashboard builder for recurring reporting work.
Sales performance
Upload a CRM or order export and compare revenue by region, product, representative, or channel. Use the top-category view to find concentration and growth opportunities.
Example: Revenue grouped by RegionFinance overview
Turn a monthly finance export into totals, averages, high points, category comparisons, and a clean management summary.
Example: Profit grouped by MonthMarketing results
Compare leads, spend, conversion, and revenue across campaigns or channels, then use AI insights to identify the strongest and weakest performers.
Example: Conversion Rate by ChannelOperations reporting
Review orders, inventory, vendors, delivery activity, or service volume without rebuilding the same report every week.
Example: Orders grouped by SupplierBuild the report faster without losing the business context.
Manual dashboard process
- Clean and inspect columns manually
- Create formulas for every KPI
- Choose and format charts one by one
- Rebuild summaries when the file changes
- Write conclusions separately
Guided dashboard workflow
- Automatic metric and category detection
- Instant KPI calculations
- Ready-to-review visual breakdowns
- Metric and grouping selectors
- AI insights, saving, printing and export
Useful for teams that live in spreadsheets.
Small business owners
Get a management view without hiring a data analyst for every report.
Finance and operations teams
Turn recurring exports into consistent performance reviews.
Sales and marketing managers
Compare channels, products, regions, leads, and customer results.
Consultants and agencies
Create cleaner client-ready summaries from supplied spreadsheet data.
Business Dashboard Builder questions
Answers about supported files, privacy, customization, saving, and reporting.
Which spreadsheet files can I upload?
The builder supports XLSX, XLSM, XLS, and CSV files accepted by SheetWise. Structured files with clear column headers produce the best results.
What types of dashboards can I create?
You can build sales, finance, marketing, operations, inventory, customer, and management dashboards from the same flexible workspace.
Does SheetWise change my original spreadsheet?
No. SheetWise analyzes a temporary copy and creates a separate dashboard. Your original file remains unchanged.
Can I choose different metrics and categories?
Yes. After upload, select any detected numeric column as the primary metric and any suitable text column as the grouping dimension.
Can I use the dashboard for monthly reporting?
Yes. Save the dashboard to your Workspace, update it with fresh data, print it, or export a CSV summary for recurring reports.
Will the AI explain the results?
Yes. SheetWise highlights totals, averages, high-performing categories, patterns, possible data-quality issues, and practical next steps.
Can I print or save the dashboard as a PDF?
Yes. The Print / PDF action creates a clean printable view that can be saved as a PDF through your browser.
Is my uploaded business data public?
No. Uploaded files are used to generate your private analysis. Saved dashboards are associated with your authenticated Workspace account.
READY TO BUILD?
Turn your next spreadsheet into a business dashboard.
Upload a file, review the automatically generated KPIs and charts, then save or export the result.