
AI Profit & Loss Analyzer Pro
Turn Excel or CSV financial data into a management-ready P&L report with revenue, COGS, gross profit, operating expenses, net profit, margins, period comparisons, expense drivers, risks, and prioritized recommendations.
Strong
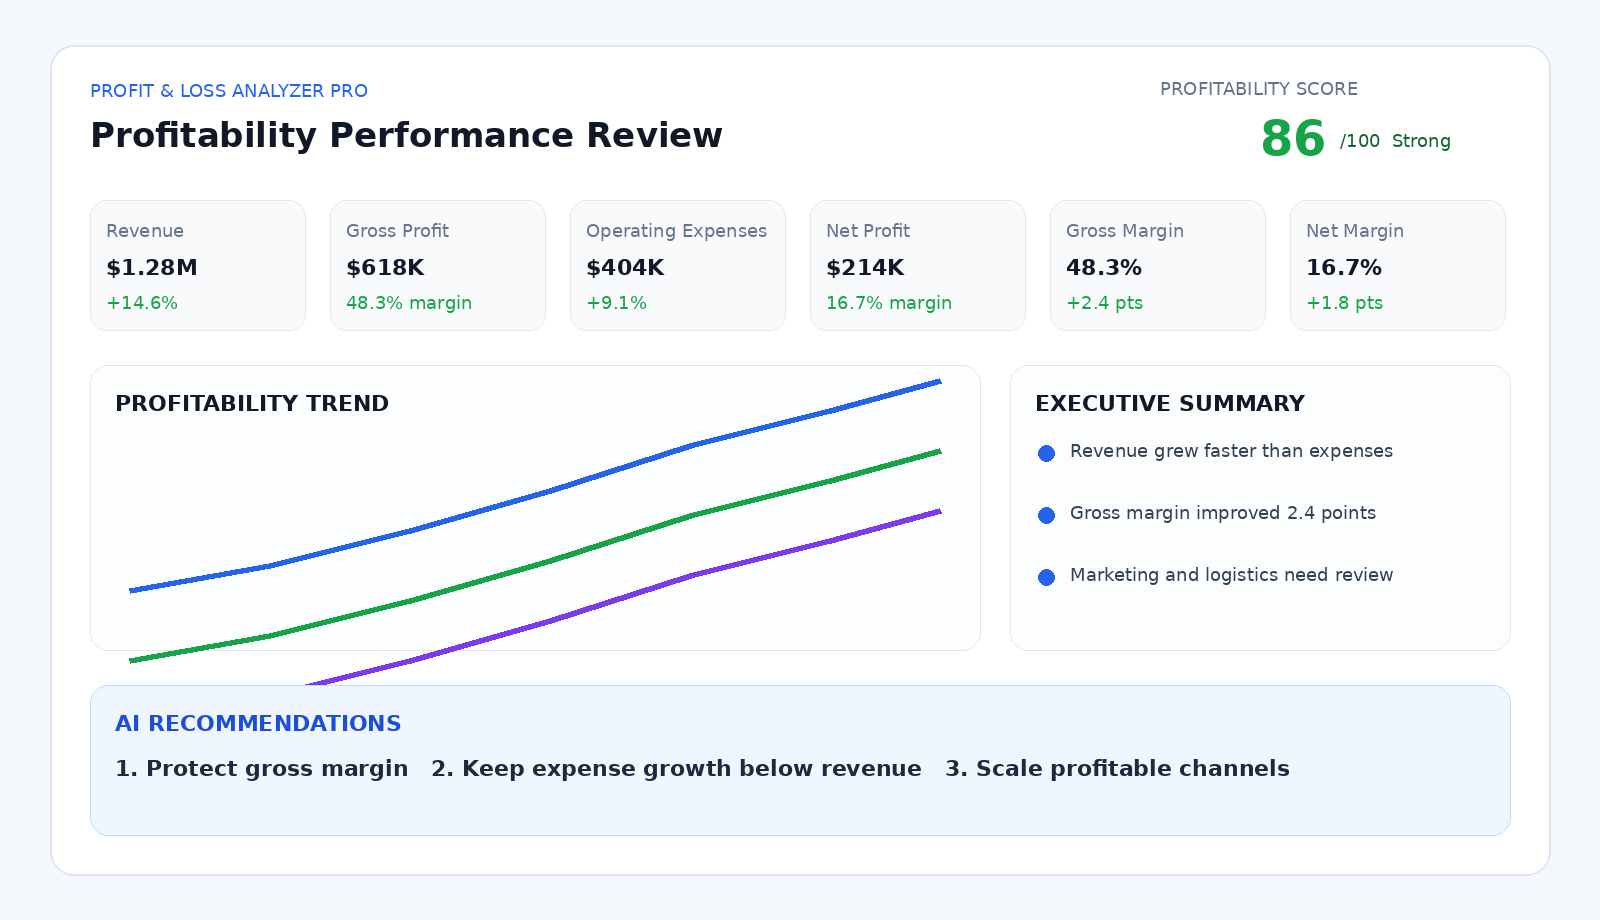
Executive insight: Profitability improved as revenue grew faster than operating expenses, but marketing and logistics require attention.
A complete profitability report, not another raw spreadsheet.
Show owners and managers what drives revenue, where margins are changing, which expenses need attention, and what actions should happen next.
Profitability
Revenue, COGS, gross profit, operating expenses, net profit, gross margin, and net margin.
Performance trends
Period-over-period growth, margin movement, and expense category changes.
Management actions
Risks, opportunities, anomaly alerts, and prioritized recommendations.
Build the P&L report
Upload transaction-level or monthly summarized financial data. The analyzer automatically detects periods, revenue, COGS, expenses, and profit.
Recommended columns: Month or Date, Revenue, COGS, Operating Expenses, Category, Department, and Notes.
Profitability Performance Review
Prepared by SheetWise AI
Revenue, gross profit, and net profit by period
From raw financial data to a decision-ready P&L.
Upload
Use accounting exports, bookkeeping summaries, or your own Excel workbook.
Analyze
SheetWise identifies revenue, costs, expenses, profit, margins, and trends.
Review
See expense drivers, margin movement, risks, opportunities, and anomalies.
Act
Save, print, or export a professional report with prioritized actions.
Understand profit, protect margins, and control expenses.
See true profitability
Separate revenue growth from actual gross profit and net profit performance.
Protect margins
Track gross and net margin movement before small declines become major problems.
Control spending
Identify the expense categories growing faster than revenue.
Compare periods
Understand exactly what improved or weakened from one period to the next.
Find opportunities
Reveal profitable categories, cost-saving opportunities, and operational leverage.
Communicate clearly
Create a management-ready report for owners, partners, lenders, or advisors.
Profit & Loss Analyzer Pro questions
What data can I upload?
Excel or CSV files containing monthly or transaction-level dates, revenue, sales, COGS, operating expenses, categories, departments, or notes.
How are gross and net margins calculated?
Gross margin compares gross profit with revenue. Net margin compares net profit with revenue after operating expenses.
Can the tool detect different column names?
Yes. It recognizes common labels such as Sales, Income, Direct Costs, Cost of Sales, Expenses, Payroll, Marketing, and Net Income.
Can I test it without a file?
Yes. Load the professional example or download the included sample workbook.
Can I print or export the report?
Yes. The report supports Open PDF & Print, Excel-compatible export, and Workspace saving.
Does it work on iPad and mobile?
Yes. Upload, analysis, report viewing, saving, and printing are responsive across desktop, iPad, and mobile.